python bokeh_使用Bokeh在Python中进行交互式数据可视化-程序员宅基地
技术标签: python 可视化 java 数据分析 大数据
python bokeh
Bokeh prides itself on being a library for interactive data visualization.
Bokeh以成为交互式数据可视化的库而自豪。
Unlike popular counterparts in the Python visualization space, like Matplotlib and Seaborn, Bokeh renders its graphics using HTML and JavaScript. This makes it a great candidate for building web-based dashboards and applications. However, it’s an equally powerful tool for exploring and understanding your data or creating beautiful custom charts for a project or report.
与Python可视化领域的流行同行(例如Matplotlib和Seaborn)不同,Bokeh使用HTML和JavaScript渲染其图形。 这使其非常适合构建基于Web的仪表板和应用程序。 但是,它是用于浏览和理解数据或为项目或报告创建漂亮的自定义图表的功能同样强大的工具。
Using a number of examples on a real-world dataset, the goal of this tutorial is to get you up and running with Bokeh.
通过使用真实数据集上的许多示例,本教程的目标是使您开始使用Bokeh。
You’ll learn how to:
您将学习如何:
- Transform your data into visualizations, using Bokeh
- Customize and organize your visualizations
- Add interactivity to your visualizations
- 使用Bokeh 将数据转换为可视化
- 自定义和组织可视化
- 为可视化添加交互性
So let’s jump in.
因此,让我们进入。
Free Bonus: Click here to get access to a chapter from Python Tricks: The Book that shows you Python’s best practices with simple examples you can apply instantly to write more beautiful + Pythonic code.
免费红利: 单击此处可访问Python技巧的一章:该书通过简单的示例向您展示了Python的最佳实践,您可以立即应用这些示例编写更精美的Pythonic代码。
从数据到可视化 (From Data to Visualization)
Building a visualization with Bokeh involves the following steps:
使用Bokeh构建可视化过程涉及以下步骤:
- Prepare the data
- Determine where the visualization will be rendered
- Set up the figure(s)
- Connect to and draw your data
- Organize the layout
- Preview and save your beautiful data creation
- 准备数据
- 确定可视化将在哪里呈现
- 设置数字
- 连接并绘制数据
- 整理布局
- 预览并保存您创建的漂亮数据
Let’s explore each step in more detail.
让我们更详细地探索每个步骤。
准备数据 (Prepare the Data)
Any good data visualization starts with—you guessed it—data. If you need a quick refresher on handling data in Python, definitely check out the growing number of excellent Real Python tutorials on the subject.
任何好的数据可视化都始于(您猜对了)数据。 如果您需要快速处理Python中的数据,请一定要查看有关该主题的越来越多的出色Real Python教程 。
This step commonly involves data handling libraries like Pandas and Numpy and is all about taking the required steps to transform it into a form that is best suited for your intended visualization.
此步骤通常涉及诸如Pandas和Numpy之类的数据处理库,并且全部涉及采取必要步骤将其转换为最适合您的预期可视化的形式。
确定可视化将在哪里渲染 (Determine Where the Visualization Will Be Rendered)
At this step, you’ll determine how you want to generate and ultimately view your visualization. In this tutorial, you’ll learn about two common options that Bokeh provides: generating a static HTML file and rendering your visualization inline in a Jupyter Notebook.
在这一步,您将确定如何生成并最终查看可视化效果。 在本教程中,您将了解Bokeh提供的两个常用选项:生成静态HTML文件以及在Jupyter Notebook中内嵌呈现可视化效果。
设置图 (Set up the Figure(s))
From here, you’ll assemble your figure, preparing the canvas for your visualization. In this step, you can customize everything from the titles to the tick marks. You can also set up a suite of tools that can enable various user interactions with your visualization.
在这里,您将组装图形,为可视化准备画布。 在此步骤中,您可以自定义从标题到刻度线的所有内容。 您还可以设置一套工具,以实现与可视化的各种用户交互。
连接并绘制数据 (Connect to and Draw Your Data)
Next, you’ll use Bokeh’s multitude of renderers to give shape to your data. Here, you have the flexibility to draw your data from scratch using the many available marker and shape options, all of which are easily customizable. This functionality gives you incredible creative freedom in representing your data.
接下来,您将使用Bokeh的大量渲染器来使数据成形。 在这里,您可以使用许多可用的标记和形状选项灵活地从头开始绘制数据,所有这些都可以轻松自定义。 此功能为您提供了令人难以置信的创作自由,可以代表您的数据。
Additionally, Bokeh has some built-in functionality for building things like stacked bar charts and plenty of examples for creating more advanced visualizations like network graphs and maps.
此外,Bokeh具有一些内置功能,可用于构建诸如堆积的条形图之类的东西,以及用于创建更高级的可视化效果(如网络图和地图)的大量示例。
整理布局 (Organize the Layout)
If you need more than one figure to express your data, Bokeh’s got you covered. Not only does Bokeh offer the standard grid-like layout options, but it also allows you to easily organize your visualizations into a tabbed layout in just a few lines of code.
如果您需要一个以上的数字来表达您的数据,那么Bokeh就可以满足您的要求。 Bokeh不仅提供标准的类似于网格的布局选项,而且还使您可以轻松地用几行代码将可视化内容组织到选项卡式布局中。
In addition, your plots can be quickly linked together, so a selection on one will be reflected on any combination of the others.
此外,您的地块可以快速链接在一起,因此一个地块的选择将反映在其他地块的任何组合上。
预览并保存您创建的漂亮数据 (Preview and Save Your Beautiful Data Creation)
Finally, it’s time to see what you created.
最后,是时候看看您创建的内容了。
Whether you’re viewing your visualization in a browser or notebook, you’ll be able to explore your visualization, examine your customizations, and play with any interactions that were added.
无论您是在浏览器中还是在笔记本电脑中查看可视化,您都可以浏览可视化,检查自定义设置并进行添加的交互。
If you like what you see, you can save your visualization to an image file. Otherwise, you can revisit the steps above as needed to bring your data vision to reality.
如果您喜欢所看到的内容,则可以将可视化文件保存到图像文件中。 否则,您可以根据需要重新查看上述步骤,以实现数据愿景。
That’s it! Those six steps are the building blocks for a tidy, flexible template that can be used to take your data from the table to the big screen:
而已! 这六个步骤是一个整洁,灵活的模板的构建块,可用于将数据从表移至大屏幕:
 """Bokeh Visualization Template

"""Bokeh Visualization Template

This template is a general outline for turning your data into a
This template is a general outline for turning your data into a
visualization using Bokeh.
visualization using Bokeh.
"""
"""
# Data handling
# Data handling
import import pandas pandas as as pd
pd
import import numpy numpy as as np

np

# Bokeh libraries
# Bokeh libraries
from from bokeh.io bokeh.io import import output_fileoutput_file , , output_notebook
output_notebook
from from bokeh.plotting bokeh.plotting import import figurefigure , , show
show
from from bokeh.models bokeh.models import import ColumnDataSource
ColumnDataSource
from from bokeh.layouts bokeh.layouts import import rowrow , , columncolumn , , gridplot
gridplot
from from bokeh.models.widgets bokeh.models.widgets import import TabsTabs , , Panel

Panel

# Prepare the data

# Prepare the data

# Determine where the visualization will be rendered
# Determine where the visualization will be rendered
output_fileoutput_file (( 'filename.html''filename.html' )  )  # Render to static HTML, or
# Render to static HTML, or
output_notebookoutput_notebook ()  ()  # Render inline in a Jupyter Notebook

# Render inline in a Jupyter Notebook

# Set up the figure(s)
# Set up the figure(s)
fig fig = = figurefigure ()  ()  # Instantiate a figure() object

# Instantiate a figure() object

# Connect to and draw the data

# Connect to and draw the data

# Organize the layout

# Organize the layout

# Preview and save
# Preview and save
showshow (( figfig )  )  # See what I made, and save if I like it
# See what I made, and save if I like it
Some common code snippets that are found in each step are previewed above, and you’ll see how to fill out the rest as you move through the rest of the tutorial!
上面已预览了每个步骤中发现的一些常见代码段,在本教程的其余部分中,您将看到如何填写其余部分!
产生你的第一个数字 (Generating Your First Figure)
There are multiple ways to output your visualization in Bokeh. In this tutorial, you’ll see these two options:
有多种方法可以在Bokeh中输出可视化效果 。 在本教程中,您将看到以下两个选项:
output_file('filename.html')will write the visualization to a static HTML file.output_notebook()will render your visualization directly in a Jupyter Notebook.
-
output_file('filename.html')会将可视化内容写入静态HTML文件。 -
output_notebook()将直接在Jupyter Notebook中呈现可视化效果。
It’s important to note that neither function will actually show you the visualization. That doesn’t happen until show() is called. However, they will ensure that, when show() is called, the visualization appears where you intend it to.
重要的是要注意,这两个功能实际上都不会为您显示可视化效果。 在调用show()之前不会发生这种情况。 但是,它们将确保在调用show()时,可视化内容将显示在您想要的位置。
By calling both output_file() and output_notebook() in the same execution, the visualization will be rendered both to a static HTML file and inline in the notebook. However, if for whatever reason you run multiple output_file() commands in the same execution, only the last one will be used for rendering.
通过在同一执行中同时调用output_file()和output_notebook() ,可视化文件将呈现为静态HTML文件并在笔记本中内联。 但是,如果出于某种原因在同一执行中运行多个output_file()命令,则仅使用最后一个命令进行渲染。
This is a great opportunity to give you your first glimpse at a default Bokeh figure() using output_file():
这是一个很好的机会,可以使用output_file()默认的Bokeh figure() output_file() :
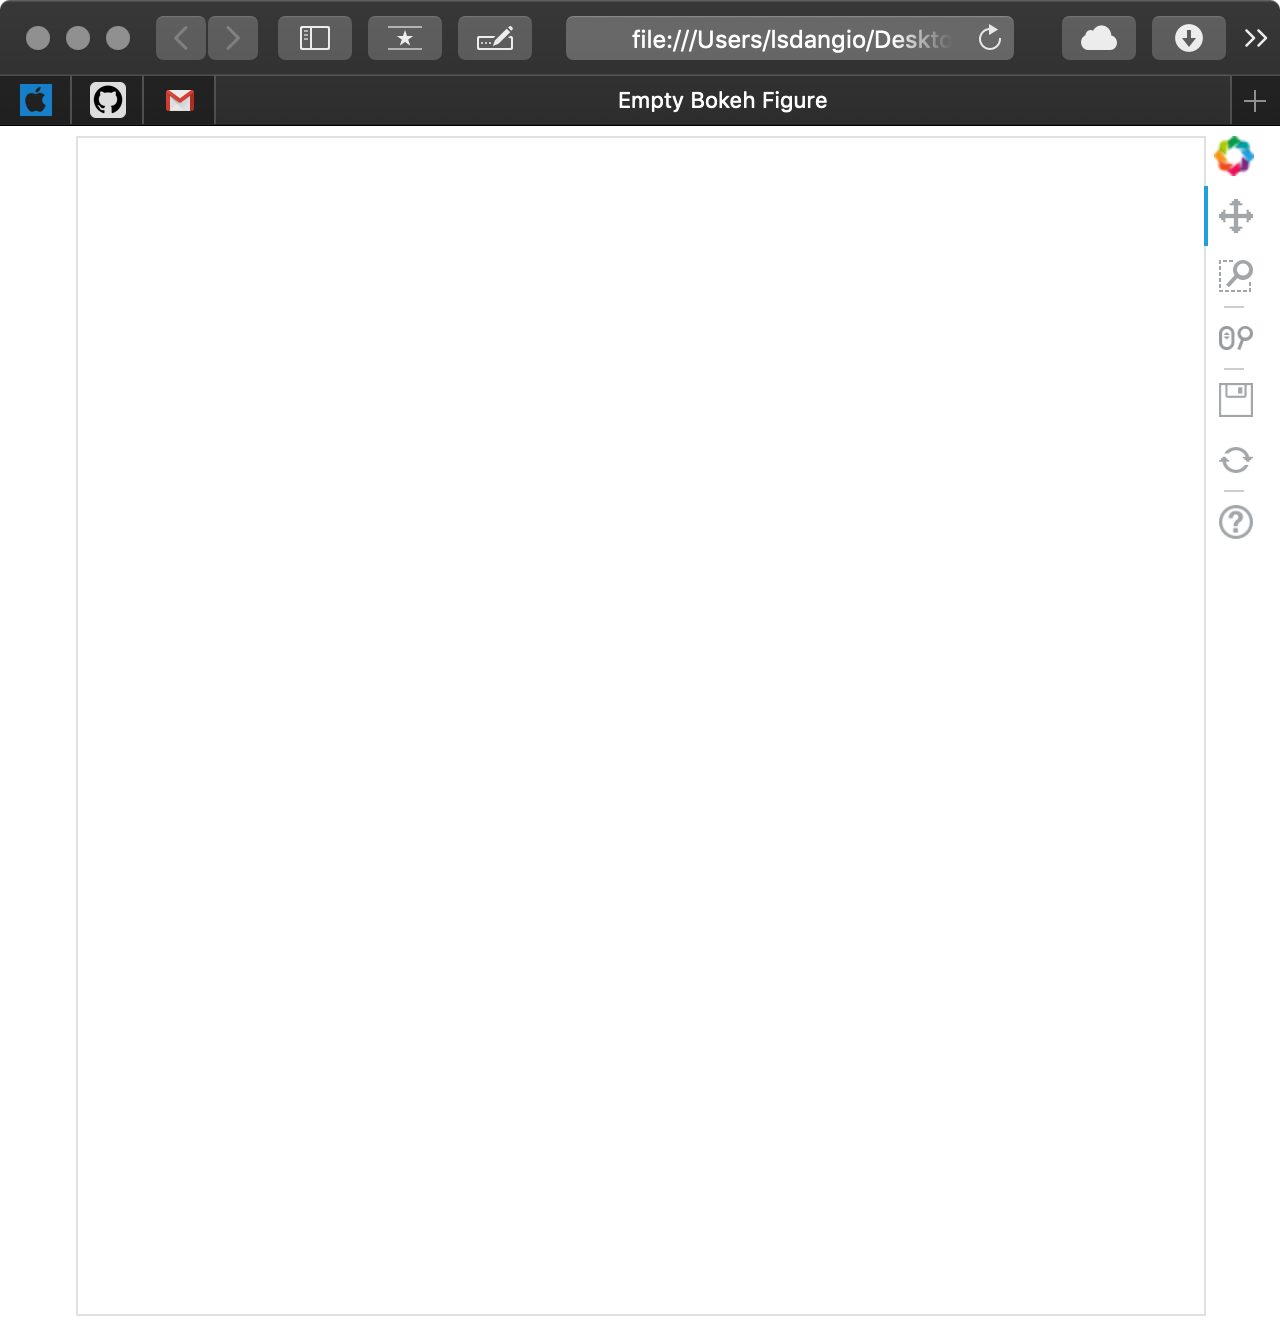
As you can see, a new browser window opened with a tab called Empty Bokeh Figure and an empty figure. Not shown is the file generated with the name output_file_test.html in your current working directory.
如您所见,将打开一个新的浏览器窗口,其中包含一个名为Empty Bokeh Figure和一个空图的选项卡。 在当前工作目录中未显示名称为output_file_test.html的文件。
If you were to run the same code snippet with output_notebook() in place of output_file(), assuming you have a Jupyter Notebook fired up and ready to go, you will get the following:
如果要使用output_notebook()代替output_file()运行相同的代码段,并假设已启动Jupyter Notebook并准备就绪,则将获得以下内容:
 # Bokeh Libraries
# Bokeh Libraries
from from bokeh.io bokeh.io import import output_notebook
output_notebook
from from bokeh.plotting bokeh.plotting import import figurefigure , , show

show

# The figure will be right in my Jupyter Notebook
# The figure will be right in my Jupyter Notebook
output_notebookoutput_notebook ()

()

# Set up a generic figure() object
# Set up a generic figure() object
fig fig = = figurefigure ()

()

# See what it looks like
# See what it looks like
showshow (( figfig )
)
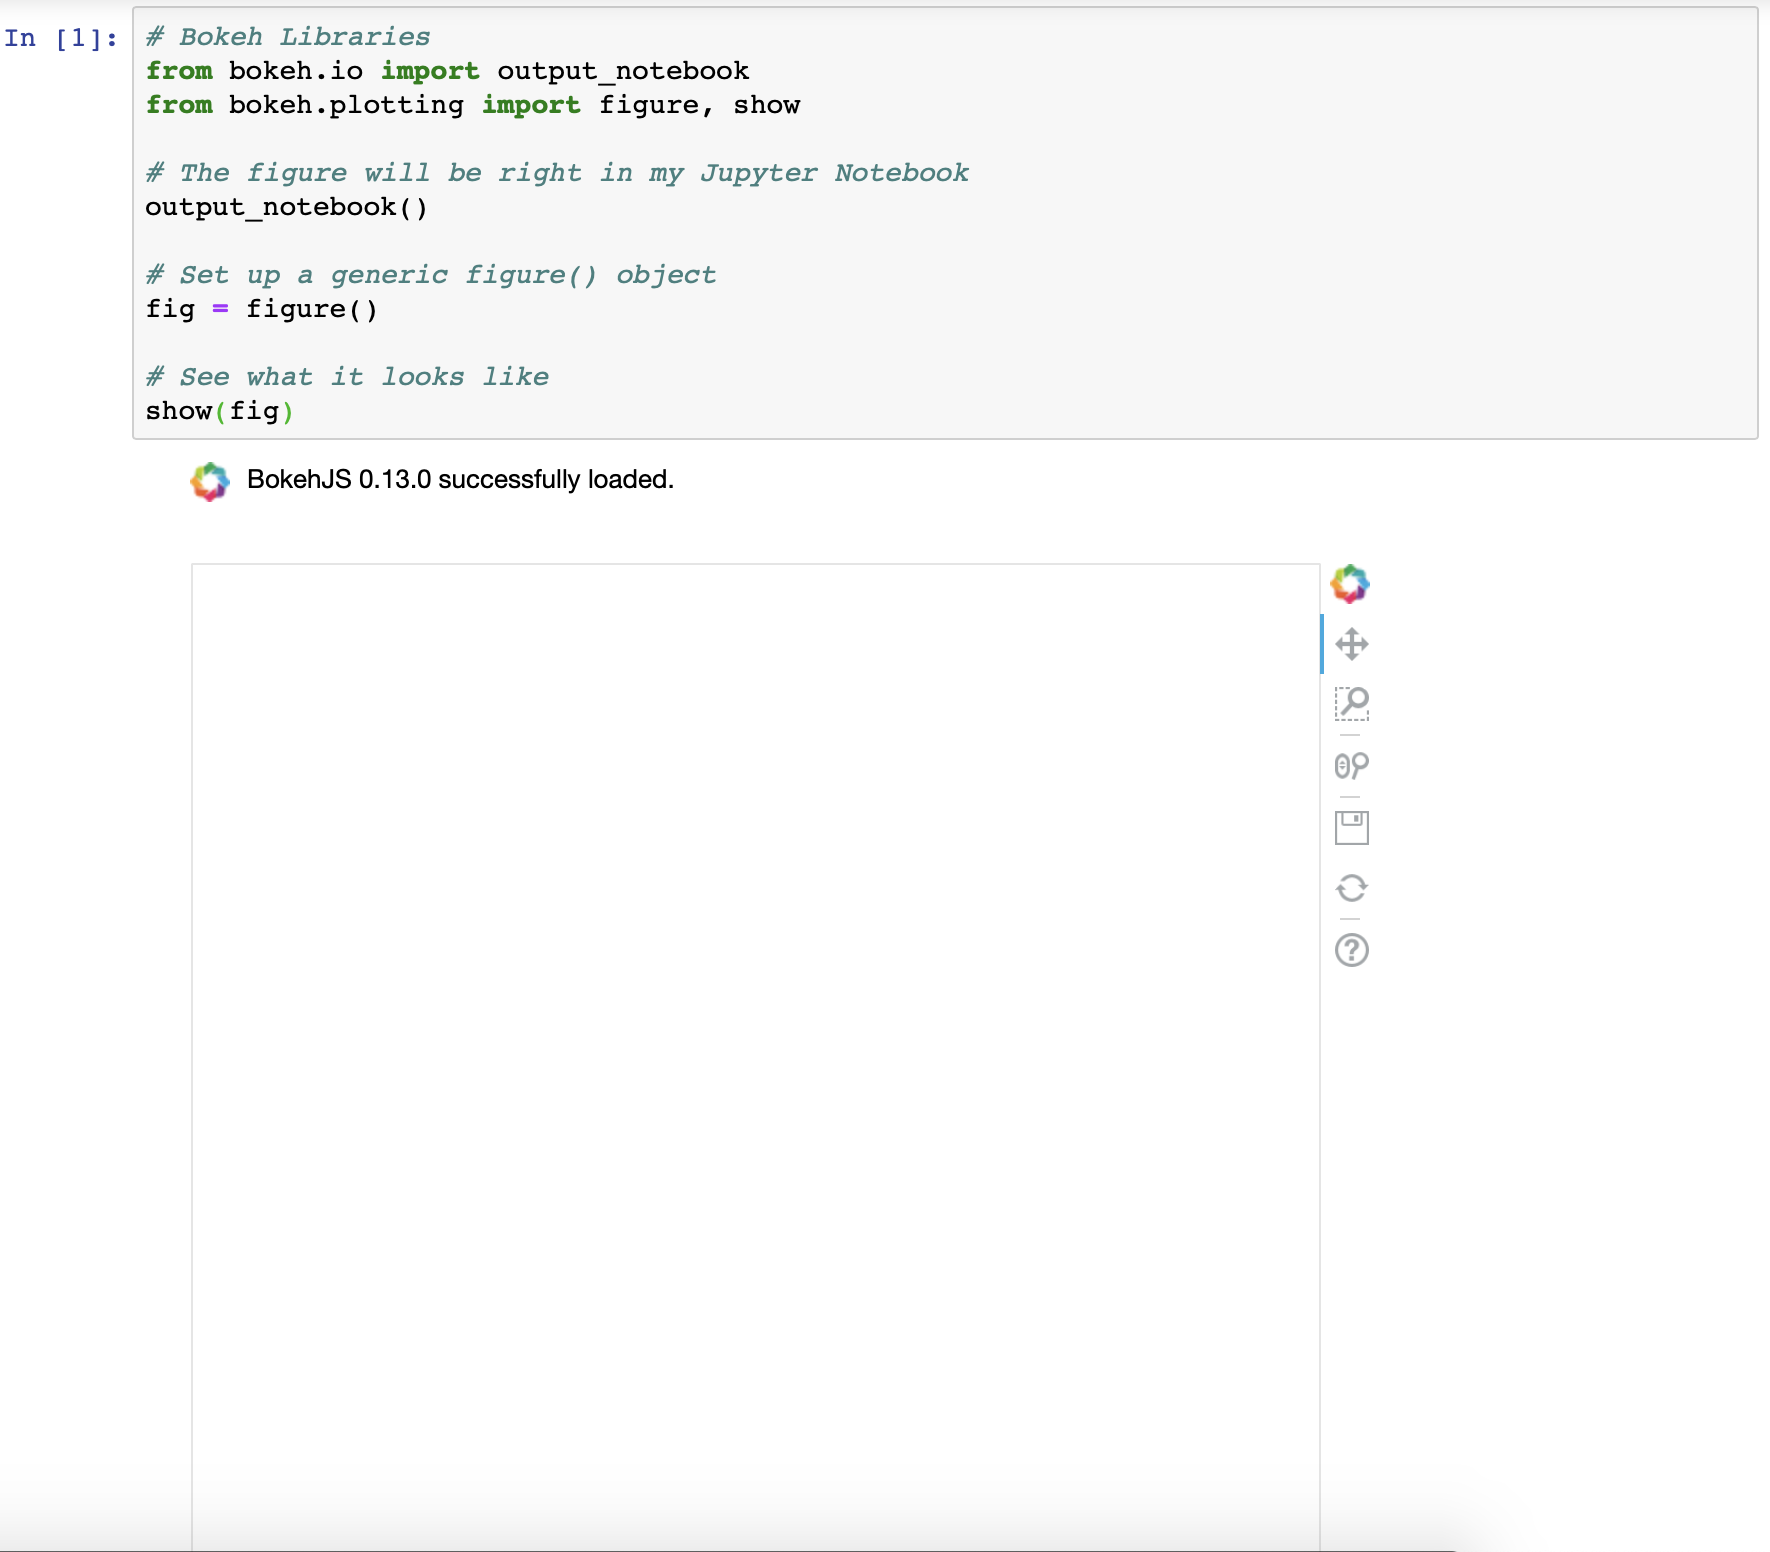
As you can see, the result is the same, just rendered in a different location.
如您所见,结果是相同的,只是在不同的位置呈现。
More information about both output_file() and output_notebook() can be found in the Bokeh official docs.
可以在Bokeh官方文档中找到有关output_file()和output_notebook()更多信息。
Note: Sometimes, when rendering multiple visualizations sequentially, you’ll see that past renders are not being cleared with each execution. If you experience this, import and run the following between executions:
注意:有时,当顺序渲染多个可视化对象时,您会看到每次执行都不会清除过去的渲染。 如果遇到这种情况,请在两次执行之间导入并运行以下命令:
Before moving on, you may have noticed that the default Bokeh figure comes pre-loaded with a toolbar. This is an important sneak preview into the interactive elements of Bokeh that come right out of the box. You’ll find out more about the toolbar and how to configure it in the Adding Interaction section at the end of this tutorial.
在继续之前,您可能已经注意到默认的Bokeh图形已预装了工具栏。 这是开箱即用的Bokeh交互元素的重要预览。 您将在本教程结尾的“ 添加交互”部分中找到有关工具栏以及如何配置它的更多信息。
为数据做好准备 (Getting Your Figure Ready for Data)
Now that you know how to create and view a generic Bokeh figure either in a browser or Jupyter Notebook, it’s time to learn more about how to configure the figure() object.
既然您知道如何在浏览器或Jupyter Notebook中创建和查看通用的Bokeh人物,是时候了解有关如何配置fig figure()对象的更多信息了。
The figure() object is not only the foundation of your data visualization but also the object that unlocks all of Bokeh’s available tools for visualizing data. The Bokeh figure is a subclass of the Bokeh Plot object, which provides many of the parameters that make it possible to configure the aesthetic elements of your figure.
figure()对象不仅是数据可视化的基础,而且是解锁Bokeh可用的用于可视化数据的所有工具的对象。 散景图是“ 散景图”对象的子类,该对象提供许多参数,这些参数使您可以配置图形的美学元素。
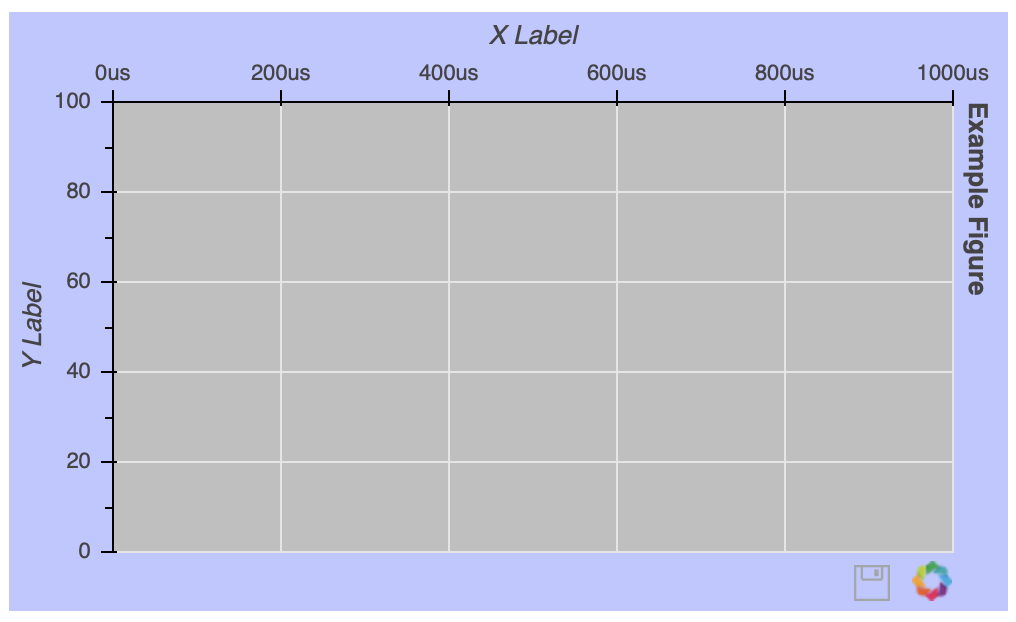
To show you just a glimpse into the customization options available, let’s create the ugliest figure ever:
为了让您了解可用的自定义选项,让我们创建有史以来最丑陋的人物:
 # Bokeh Libraries
# Bokeh Libraries
from from bokeh.io bokeh.io import import output_notebook
output_notebook
from from bokeh.plotting bokeh.plotting import import figurefigure , , show

show

# The figure will be rendered inline in my Jupyter Notebook
# The figure will be rendered inline in my Jupyter Notebook
output_notebookoutput_notebook ()

()

# Example figure
# Example figure
fig fig = = figurefigure (( background_fill_colorbackground_fill_color == 'gray''gray' ,
             ,
             background_fill_alphabackground_fill_alpha == 0.50.5 ,
             ,
             border_fill_colorborder_fill_color == 'blue''blue' ,
             ,
             border_fill_alphaborder_fill_alpha == 0.250.25 ,
             ,
             plot_heightplot_height == 300300 ,
             ,
             plot_widthplot_width == 500500 ,
             ,
             h_symmetryh_symmetry == TrueTrue ,
             ,
             x_axis_labelx_axis_label == 'X Label''X Label' ,
             ,
             x_axis_typex_axis_type == 'datetime''datetime' ,
             ,
             x_axis_locationx_axis_location == 'above''above' ,
             ,
             x_rangex_range == (( '2018-01-01''2018-01-01' , , '2018-06-30''2018-06-30' ),
             ),
             y_axis_labely_axis_label == 'Y Label''Y Label' ,
             ,
             y_axis_typey_axis_type == 'linear''linear' ,
             ,
             y_axis_locationy_axis_location == 'left''left' ,
             ,
             y_rangey_range == (( 00 , , 100100 ),
             ),
             titletitle == 'Example Figure''Example Figure' ,
             ,
             title_locationtitle_location == 'right''right' ,
             ,
             toolbar_locationtoolbar_location == 'below''below' ,
             ,
             toolstools == 'save''save' )

)

# See what it looks like
# See what it looks like
showshow (( figfig )
)
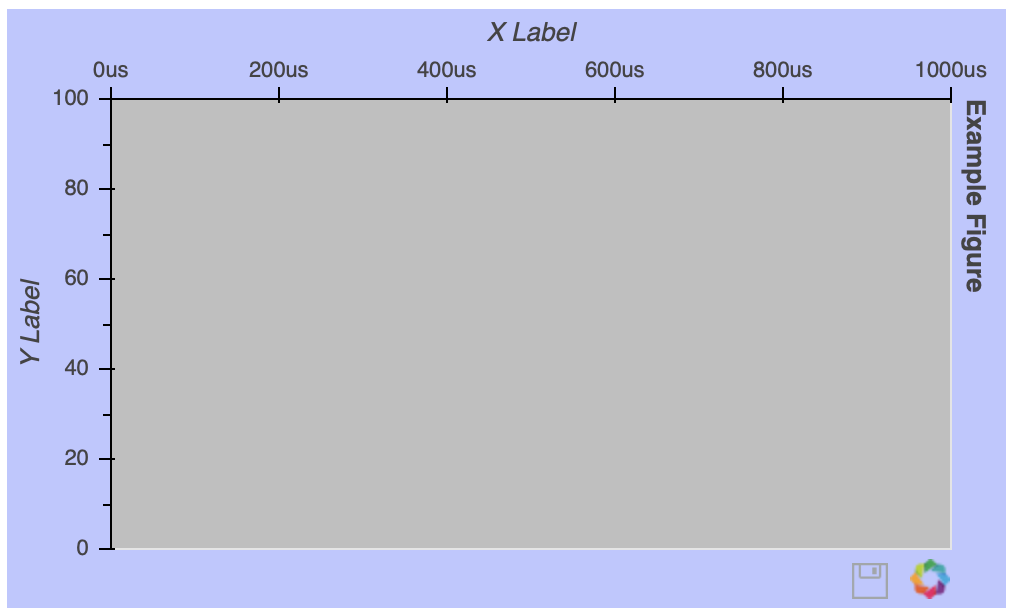
Once the figure() object is instantiated, you can still configure it after the fact. Let’s say you want to get rid of the gridlines:
实例化fig figure()对象后,您仍然可以在配置之后进行配置。 假设您要摆脱网格线:
The gridline properties are accessible via the figure’s grid attribute. In this case, setting grid_line_color to None effectively removes the gridlines altogether. More details about figure attributes can be found below the fold in the Plot class documentation.
可通过图形的grid属性访问gridline属性。 在这种情况下,将grid_line_color设置为None可以完全删除网格线。 有关图形属性的更多详细信息,可以在Plot类文档的首屏下面找到。
Note: If you’re working in a notebook or IDE with auto-complete functionality, this feature can definitely be your friend! With so many customizable elements, it can be very helpful in discovering the available options:
注意:如果您使用的是具有自动完成功能的笔记本电脑或IDE,那么此功能绝对可以成为您的朋友! 有这么多可定制的元素,在发现可用选项时会非常有帮助:
Otherwise, doing a quick web search, with the keyword bokeh and what you are trying to do, will generally point you in the right direction.
否则,使用关键字bokeh和您要尝试的操作进行快速的网络搜索通常会为您指明正确的方向。
There is tons more I could touch on here, but don’t feel like you’re missing out. I’ll make sure to introduce different figure tweaks as the tutorial progresses. Here are some other helpful links on the topic:
在这里,我还有很多其他可以触及的地方,但不要觉得您错过了。 随着教程的进行,我将确保引入不同的图形调整。 这是有关此主题的其他一些有用的链接:
- The Bokeh Plot Class is the superclass of the
figure()object, from which figures inherit a lot of their attributes. - The Figure Class documentation is a good place to find more detail about the arguments of the
figure()object.
- 散景图类是fig
figure()对象的超类,figure()从中继承许多属性。 - Figure Class文档是查找关于
figure()对象的参数的更多详细信息的好地方。
Here are a few specific customization options worth checking out:
以下是一些值得一试的自定义选项:
- Text Properties covers all the attributes related to changing font styles, sizes, colors, and so forth.
- TickFormatters are built-in objects specifically for formatting your axes using Python-like string formatting syntax.
- 文本属性涵盖与更改字体样式,大小,颜色等有关的所有属性。
- TickFormatters是内置对象,专门用于使用类似Python的字符串格式语法来格式化轴。
Sometimes, it isn’t clear how your figure needs to be customized until it actually has some data visualized in it, so next you’ll learn how to make that happen.
有时,在实际显示一些数据之前,还不清楚如何对您的图形进行自定义,因此接下来您将学习如何实现这一目标。
使用字形绘制数据 (Drawing Data With Glyphs)
An empty figure isn’t all that exciting, so let’s look at glyphs: the building blocks of Bokeh visualizations. A glyph is a vectorized graphical shape or marker that is used to represent your data, like a circle or square. More examples can be found in the
智能推荐
JavaScript学习笔记_curry函数未定义-程序员宅基地
文章浏览阅读343次。五种原始的变量类型1.Undefined--未定义类型 例:var v;2.String -- ' '或" "3.Boolean4.Number5.Null--空类型 例: var v=null;Number中:NaN -- not a number非数本身是一个数字,但是它和任何数字都不相等,代表非数,它和自己都不相等判断是不是NaN不能用=_curry函数未定义
兑换码编码方案实践_优惠券编码规则-程序员宅基地
文章浏览阅读1.2w次,点赞2次,收藏17次。兑换码编码设计当前各个业务系统,只要涉及到产品销售,就离不开大大小小的运营活动需求,其中最普遍的就是兑换码需求,无论是线下活动或者是线上活动,都能起到良好的宣传效果。兑换码:由一系列字符组成,每一个兑换码对应系统中的一组信息,可以是优惠信息(优惠券),也可以是相关奖品信息。在实际的运营活动中,要求兑换码是唯一的,每一个兑换码对应一个优惠信息,而且需求量往往比较大(实际上的需求只有预期_优惠券编码规则
c语言周林答案,C语言程序设计实训教程教学课件作者周林ch04结构化程序设计课件.ppt...-程序员宅基地
文章浏览阅读45次。C语言程序设计实训教程教学课件作者周林ch04结构化程序设计课件.ppt* * 4.1 选择结构程序设计 4.2 循环结构程序设计 4.3 辅助控制语句 第四章 结构化程序设计 4.1 选择结构程序设计 在现实生活中,需要进行判断和选择的情况是很多的: 如果你在家,我去拜访你 如果考试不及格,要补考 如果遇到红灯,要停车等待 第四章 结构化程序设计 在现实生活中,需要进行判断和选择的情况..._在现实生活中遇到过条件判断的问
幻数使用说明_ioctl-number.txt幻数说明-程序员宅基地
文章浏览阅读999次。幻数使用说明 在驱动程序中实现的ioctl函数体内,实际上是有一个switch{case}结构,每一个case对应一个命令码,做出一些相应的操作。怎么实现这些操作,这是每一个程序员自己的事情。 因为设备都是特定的,这里也没法说。关键在于怎样组织命令码,因为在ioctl中命令码是唯一联系用户程序命令和驱动程序支持的途径 。 命令码的组织是有一些讲究的,因为我们一定要做到命令和设备是一一对应的,利_ioctl-number.txt幻数说明
ORB-SLAM3 + VScode:检测到 #include 错误。请更新 includePath。已为此翻译单元禁用波浪曲线_orb-slam3 include <system.h> 报错-程序员宅基地
文章浏览阅读399次。键盘按下“Shift+Ctrl+p” 输入: C++Configurations,选择JSON界面做如下改动:1.首先把 “/usr/include”,放在最前2.查看C++路径,终端输入gcc -v -E -x c++ - /usr/include/c++/5 /usr/include/x86_64-linux-gnu/c++/5 /usr/include/c++/5/backward /usr/lib/gcc/x86_64-linux-gnu/5/include /usr/local/_orb-slam3 include 报错
「Sqlserver」数据分析师有理由爱Sqlserver之十-Sqlserver自动化篇-程序员宅基地
文章浏览阅读129次。本系列的最后一篇,因未有精力写更多的入门教程,上篇已经抛出书单,有兴趣的朋友可阅读好书来成长,此系列主讲有理由爱Sqlserver的论证性文章,希望读者们看完后,可自行做出判断,Sqlserver是否真的合适自己,目的已达成。渴望自动化及使用场景笔者所最能接触到的群体为Excel、PowerBI用户群体,在Excel中,我们知道可以使用VBA、VSTO来给Excel带来自动化操作..._sqlsever 数据分析
随便推点
智慧校园智慧教育大数据平台(教育大脑)项目建设方案PPT_高校智慧大脑-程序员宅基地
文章浏览阅读294次,点赞6次,收藏4次。教育智脑)建立学校的全连接中台,对学校运营过程中的数据进行处理和标准化管理,挖掘数据的价值。能:一、原先孤立的系统聚合到一个统一的平台,实现单点登录,统一身份认证,方便管理;三、数据共享,盘活了教育大数据资源,通过对外提供数。的方式构建教育的通用服务能力平台,支撑教育核心服务能力的沉淀和共享。物联网将学校的各要素(人、机、料、法、环、测)全面互联,数据实时。智慧校园解决方案,赋能教学、管理和服务升级,智慧教育体系,该数据平台具有以下几大功。教育大数据平台底座:教育智脑。教育大数据平台,以中国联通。_高校智慧大脑
编程5大算法总结--概念加实例_算法概念实例-程序员宅基地
文章浏览阅读9.5k次,点赞2次,收藏27次。分治法,动态规划法,贪心算法这三者之间有类似之处,比如都需要将问题划分为一个个子问题,然后通过解决这些子问题来解决最终问题。但其实这三者之间的区别还是蛮大的。贪心是则可看成是链式结构回溯和分支界限为穷举式的搜索,其思想的差异是深度优先和广度优先一:分治算法一、基本概念在计算机科学中,分治法是一种很重要的算法。字面上的解释是“分而治之”,就是把一个复杂的问题分成两_算法概念实例
随笔—醒悟篇之考研调剂_考研调剂抑郁-程序员宅基地
文章浏览阅读5.6k次。考研篇emmmmm,这是我随笔篇章的第二更,原本计划是在中秋放假期间写好的,但是放假的时候被安排写一下单例模式,做了俩机试题目,还刷了下PAT的东西,emmmmm,最主要的还是因为我浪的很开心,没空出时间来写写东西。 距离我考研结束已经快两年了,距离今年的考研还有90天左右。 趁着这个机会回忆一下青春,这一篇会写的比较有趣,好玩,纯粹是为了记录一下当年考研中发生的有趣的事。 首先介绍..._考研调剂抑郁
SpringMVC_class org.springframework.web.filter.characterenco-程序员宅基地
文章浏览阅读438次。SpringMVC文章目录SpringMVC1、SpringMVC简介1.1 什么是MVC1.2 什么是SpringMVC1.3 SpringMVC的特点2、HelloWorld2.1 开发环境2.2 创建maven工程a>添加web模块b>打包方式:warc>引入依赖2.3 配置web.xml2.4 创建请求控制器2.5 创建SpringMVC的配置文件2.6 测试Helloworld2.7 总结3、@RequestMapping注解3.1 @RequestMapping注解的功能3._class org.springframework.web.filter.characterencodingfilter is not a jakart
gdb: Don‘t know how to run. Try “help target“._don't know how to run. try "help target".-程序员宅基地
文章浏览阅读4.9k次。gdb 远程调试的一个问题:Don't know how to run. Try "help target".它在抱怨不知道怎么跑,目标是什么. 你需要为它指定target remote 或target extended-remote例如:target extended-remote 192.168.1.136:1234指明target 是某IP的某端口完整示例如下:targ..._don't know how to run. try "help target".
c语言程序设计教程 郭浩志,C语言程序设计教程答案杨路明郭浩志-程序员宅基地
文章浏览阅读85次。习题 11、算法描述主要是用两种基本方法:第一是自然语言描述,第二是使用专用工具进行算法描述2、c 语言程序的结构如下:1、c 语言程序由函数组成,每个程序必须具有一个 main 函数作为程序的主控函数。2、“/*“与“*/“之间的内容构成 c 语言程序的注释部分。3、用预处理命令#include 可以包含有关文件的信息。4、大小写字母在 c 语言中是有区别的。5、除 main 函数和标准库函数以..._c语言语法0x1e