linux配置部署elasticsearch集群(虚拟机、docker)_groupadd elastic && useradd elastic -g elastic -p -程序员宅基地
技术标签: elasticsearch linux 系统架构 docker
ES集群搭建
一、环境准备
- JDK 配置。
略
2. elasticsearch7.X开始需要java11,通常我们用jdk1.8作为共有环境变量,我们可以不安装 jdk11版本 。但启动会报错,因为与现有环境变量冲突。
敲黑板:
es安装包包含一个相匹配的 JAVA 版本,只需修改配置文件。修改启动脚本/bin/elasticsearch使用自带jdk。亲测不好使没找到原因,启动总是提示找不到JAVA_HOME。所以自己下了一个jdk11。修改/bin/elasticsearch-env文件,在判断JAVA_HOME那块逻辑前指定ES_JAVA_HOME=xxx/xxx/jdk11,可不用配置PATH。或者直接在启动脚本/bin/elasticsearch 增加export JAVA_HOME= xxx/xxx/jdk11
二、操作步骤
- 下载解压
tar zxvf elasticsearch-7.XX.X.tar.gz
curl -L -O https://artifacts.elastic.co/downloads/elasticsearch/elasticsearch-6.0.1.tar.gz或wget https://artifacts.elastic.co/downloads/elasticsearch/elasticsearch-7.15.0-linux-x86_64.tar.gz
或rpm安装Install Elasticsearch with RPM | Elasticsearch Guide [5.0] | Elastic
下载后执行rpm -ivh elasticsearch-6.8.0.rpm(rpm的方式)
2.新建ES用户组(可选)、用户及密码(启动ES 不能是ROOT权限)
groupadd elastic、 useradd elasticuser -g elastic、
passwd elasticuser xxxxxxxx
为用户赋权限
chown -R elasticuser: elastic /usr/local/elasticsearch
切换用户su elasticuser,(不要root用户,注意logs、data、config等文件夹的权限)
3.规划目录修改配置。(目录换到不属于root目录)详见配置。
启动ES, ./bin/elasticsearch -d(-d 后台启动),或nohup /opt/elastic/bin/elasticsearch > /var/elastic/es.log >&1 & 启动后访问https://ip:port正常。
4.集群启动验证
停掉进程,复制文件(集群),然后修改配置中对应端口、地址等信息(详见配置)。再逐个启动。启动后调用curl http://ip:port/_cat/nodes?v 查看集群状态
或直接http://ip:port网页访问,若访问不到可能是防火墙拦截。
踩坑:
集群启动异常,类似找不到主节点、脑裂等异常(类似master not discovered yet, this node has not previously joined a bootstrappe这种)可能是之前配置了不同nodes数据,后面再修改,但此时data目录缓存了数据,导致加载了旧的节点信息。所以需要把data目录es自动生成的node目录删除掉。(前提是你的host等配置没配错)
5.安全设置(可选)
创建keystore bin/elasticsearch-keystore create
添加keystore bin/elasticsearch-keystore add xxx
删除keystore bin/elasticsearch-keystore remove xxx
三、配置
1、JVM配置config/jvm.options(高版本)
修改JVM内存,配置原则:
(1)Xmx和Xms大小设置成一样;(默认2g)
(2)不超过物理机内存的一半;
(3)最大不宜超过30G
敲黑板:
这里卡了很久,启动后无启动日志,开始还有进程存在,后来没了。研究好久发现自己虚拟机设置内存才2g,es默认2g,配置改成516m(1g报内存溢出)启动成功。
垃圾收集器修改:
-XX:+UseConcMarkSweepGC 改为 -XX:+UseG1GC(限高版本,G1需要jdk10以上)
内存配置 bin/elasticsearch.in.sh(低版本才有)
ES_MIN_MEM、ES_MAX_MEM=2g参考数据量和当前机器内存,值相同。参考1
2.基本信息配置 config/elasticsearch.yml
http.port: 9001
transport.tcp.port: 9101
node.master: true
cluster.name: "es_cluster"
node.name: "es-01"
path.data: /home/elasticuser/cluster/elasticSearch-cluster/elasticsearch01/data
node.data: true
path.log: /home/elasticuser/cluster/elasticSearch-cluster/elasticsearch01/logs
network.host: xx.xx.xxx
discovery.seed_hosts: ["xx.xx.xx:9101","xx.xx.xx.128:9202","xx.xx.xx:9303"]
http.cors.enabled: true
http.cors.allow-origin: "*"
discovery.zen.minimum_master_nodes: 2
discovery.zen.fd.ping_interval: 1s
discovery.zen.fd.ping_timeout: 30s
discovery.zen.fd.ping_retries: 3
transport.tcp.compress: false
bootstrap.memory_lock: true
cluster.initial_master_nodes: discovery.seed_hosts: ["es-01","es-02","es-03"]
(可选择修改配置目录,修改配置环境变量ES_PATH_CONF=/path/to/my/config ./bin/elasticsearch)
必配:
http.port=8080
transport.tcp.port:8081
Cluster.name=XXXX(各节点一致、唯一)
node.name: XXX(各节点不同,eg:node-02)
node.master: true (设置主节点,都为true都是master候选人,可选)
path.data= /data/elasticsearch (索引位置,多个,分割)
node.data: true
Path.logs: xx/xx/log/
network.host: 127.0.0.1(自身IP)
bootstrap.memory_lock: true(配置保护Elasticsearch使用的内存, 请求JVM在内存中锁定堆。可选,若选true需修改后续的系统配置/system.conf 和limits.conf)
discovery.seed_hosts: [“IP:tcp端口”,” IP:tcp端口”] (集群中master节点的初始列表,“,”分割。自动发现机制,各节点都是。discovery.zen.ping.unicast.hosts是低版本用的)
cluster.initial_master_nodes: ["node-01","node-02","node-03"](设置全新群集中符合主机资格的节点的初始集合,首次启动集群时需要)
选配:
discovery.zen.minimum_master_nodes: 2(举Maste时需要的节点数,三节点时为2防止脑裂)
discovery.zen.fd.ping_interval: 1s(一个节点多久ping一次,默认)
discovery.zen.fd.ping_timeout: 30s(等待ping返回时间,默认)
discovery.zen.fd.ping_retries: 3(ping超时重试次数,默认)
index.number_of_shards: 5(设置默认索引分片个数,默认)
index.number_of_replicas: 1(设置默认索引副本个数,默认)
#head插件用
http.cors.enabled: true (是否支持跨域)
http.cors.allow-origin: "*" (域名限制 *不限制)
敲黑板:
elasticsearch5.X以上不支持包含索引级别的设置,即index开头的配置去掉。配置后会启动报错。
transport.tcp.compress: false(是否压缩tcp传输时的数据,默认为false,不压缩)
bootstrap.memory_lock: true(锁定物理内存地址,防止es内存被交换出去,调优用)
3.日志配置 config/logging.yml或log4j2.properties(可选)
主要说明如下:(具体参考log4j配置)
${sys:es.logs.base_path} 解析为日志目录
${sys:es.logs.cluster_name} 解析为集群名称
${sys:es.logs.node_name} 解析为节点名称
${sys:file.separator} 将被解析为路径分隔符
appender.rolling.filePattern = ${sys:es.logs.base_path}${sys:file.separator}${sys:es.logs.cluster_name}-%d{yyyy-MM-dd}-%i.json.gz(文件压缩后名称)
appender.rolling.policies.time.type = TimeBasedTriggeringPolicy(时间滚动策略)
appender.rolling.policies.time.interval = 1(每天滚动)
appender.rolling.policies.time.modulate = true(以天为标准输出日志)
appender.rolling.policies.size.type = SizeBasedTriggeringPolicy(基于大小滚动策略)
appender.rolling.policies.size.size = 256MB(大小滚动的阈值)
appender.rolling.strategy.type = DefaultRolloverStrategy(滚动删除策略)
appender.rolling.strategy.action.type = Delete(处理类型,删除)
appender.rolling.strategy.action.condition.nested_condition.type = IfAccumulatedFileSize (删除条件)
appender.rolling.strategy.action.condition.nested_condition.exceeds = 2GB(删除条件)
5.系统配置
能打开的最大文件描述符个数配置。ulimit -a查看max_file_descriptors参数(32K~64K,65535)
vim /etc/security/limits.conf
用户名 - nofile 65535(只es用户生效)
用户名 - nproc 32000(只es用户生效)
内存配置。/etc/systemd/system.conf(可选)
DefaultLimitMEMLOCK=infinity(若bootstrap.memory_lock为true需添加此项)
6、手动安装非.deb或.rpm包安装需配置。
root身份执行sysctl vm.max_map_count=262144;
永久设置此值:修改文件vim /etc/sysctl.conf增加一行配置vm.max_map_count = 262144。
vm.swappiness = 1
最后执行sysctl -p使其生效。
sysctl vm.max_map_count查看结果。
四、ES插件安装(可选)
1、elasticsearch-analysis-ik中分分词器安装
https://github.com/medcl/elasticsearch-analysis-ik
需maven、git环境支持,yum install -y maven、yum install -y git
git clone https://github.com/medcl/elasticsearch-analysis-ik.git
cd elasticsearch-analysis-ik/
mvn package
CP分词器jar包至xxx/elasticsearch/plugins/ik/下并解压,重启ES。
或直接执行./bin/elasticsearch-plugin install https://github.com/medcl/elasticsearch-analysis-ik/releases/download/v7.3.1/elasticsearch-analysis-ik-7.3.1.zip
2.elasticsearch-head插件安装(可选)
https://www.cnblogs.com/keystone/p/13266528.html
# yum install -y npm
# git clone git://github.com/mobz/elasticsearch-head.git
# cd elasticsearch-head
# npm install
# npm run start
直接http://ip:port访问es即可
五、KIBANA安装
1、下载解压,版本与ES对应。
Wget https://artifacts.elastic.co/downloads/kibana/kibana-7.15.0-x86_64.rpm
yum install -y kibana-6.0.0-x86_64.rpm
或curl -O https://artifacts.elastic.co/downloads/kibana/kibana-7.16.2-linux-x86_64.tar.gz
2、配置 config/kibana.yml
server.port: 5601
server.host: 192.168.1.1
elasticsearch.hosts: ["http://xxx:8080"]
kibana.index: ".kibana"
i18n.locale: " zh-CN " (指定语言,English - en , Chinese - zh-CN )
elasticsearch.username: "elastic" (ES的用户密码)
elasticsearch.password: "elastic" (ES的用户密码)
(也可秘钥库形式设置账号密码
./bin/kibana-keystore create
./bin/kibana-keystore add elasticsearch.username
./bin/kibana-keystore add elasticsearch.password)
3、启动
nohup /opt/kibana/bin/kibana &
或systemctl enable kibana
systemctl start/stop/restart kibana
用ss -antlup | grep 端口号或http://IP:PORT/验证启动成功
六、logstach安装(可选)
1、解压安装,,版本与ES对应。
wget https://artifacts.elastic.co/downloads/logstash/logstash-7.15.0.zip unzip logstash-6.2.3.zip 或tar -zvxf logstash-7.2.1.tar.gz
或curl -L -O https://artifacts.elastic.co/downloads/logstash/logstash-7.15.0.tar.gz
或sudo yum install logstash(具体步骤参见官方指导https://www.elastic.co/guide/en/logstash/current/installing-logstash.html)
2、创建规划logs、date文件目录
3、配置
配置/config/logstash.yml
http.host: "ELK1"
path.data: /data/logstash/data
path.logs: /data/logstash/logs
config.reload.automatic:true
xpack.monitoring.enabled: true #kibana监控插件中启动监控logstash
xpack.monitoring.elasticsearch.username: logstash_system
xpack.monitoring.elasticsearch.password: { 密码}
xpack.monitoring.elasticsearch.hosts: ["xx.x.x.xx:9200","xx.x.x.xx:9200","xx.x.x.xx:9200"]
创建配置文件xxx.conf
(其中账号密码可以用key-store管理,K-V形式记录,eg:执行./bin/logstash-keystore add logKey,配置里写”${logKey }”)
配置样例如下:
input {
file {
path => "/usr/share/tomcat/logs/*.log"
start_position => beginning
}
}
filter {
}
output {
elasticsearch {
hosts => ["localhost:9200"]
user => "${LS_USER}"
password => "${LS_PWD}"
}
}
index => "all_error-%{+YYYY.MM.dd}"
}
}
3、启动
sh logstash -f 配置文件 --path.data=/xx/xx/logs &
或nohup /usr/local/elk/logstash-7.2.1/bin/logstash -f /usr/local/elk/logstash-7.2.1/logstash.conf &
基于Docker集群搭建
一、docker搭建ES集群
1、简单搭建单节点
拉取镜像
docker pull elasticuser:7.14.0
启动docker服务
docker run -d --name myes -p 26001:26001 -p 26000:26000 -e ES_JAVA_OPTS="-Xms1024m -Xmx1024m" -e "discovery.type=single-node" elasticsearch:7.14.0
cluster.name: "xxxx"
network.host: 0.0.0.0(高版本用"0")
http.cors.enabled: true
http.cors.allow-origin: "*"
discovery.zen.minimum_master_nodes: 1
说明:
--name 名称 :给容器起个名字
-p 外部访问端口:容器端口 :26001是供htpp访问端口,26000是供tcp访问的端口,如果不做端口映射,浏览器就不能访问elasticsearch的服务
--network 网络名:用于多个服务通信与隔离,例如用kibana连接elasticsearch就需要他们在同一个网络
-e 配置,内存配置不可少
重启ES
docker restart es
验证ES,浏览器访问http://IP:26001(iP为容器ip,docker inspect容器名 查询容器ip)
2、集群搭建
1、规划目录,并赋予权限
/mnt/data/elasticsearch/node1
/mnt/logs/elasticsearch/node1
chown elasticuser /mnt/logs/elasticsearch/
chown elasticuser /mnt/data/elasticsearch/
2、修改系统相关配置,详见上文三中内容
3、启动
可以通过启动方式加 -e直接配置es,例子如下:
sudo docker run --name es1 --restart=always --privileged=true -d -p 26600:26600 -p 26601:26601 --memory=2G \
-v /mnt/data/elasticsearch/node1/node1.yml:/data/note1/node1.yml \
-e ES_JAVA_OPTS="-Xms1024m -Xmx1024m" \
-v /mnt/data/elasticsearch/node1/:/data/node1 \
-v /mnt/logs/elasticsearch/node1/:/logs/ \
-e cluster.name="es_cluster" \
-e node.name="node1" \
-e cluster.initial_master_nodes="node1" \
-e discovery.seed_hosts="172.17.0.4:26601","172.17.0.5:26701","172.17.0.6:26801" \
-e http.port=26600 \
-e transport.tcp.port=26601 \
-e node.master=true \
-e node.data=false \
-e network.host="0.0.0.0" \
-e discovery.zen.minimum_master_nodes=2 \
elasticsearch:7.14.0
sudo docker run --name es2 --restart=always --privileged=true -d -p 26700:26700 -p 26701:26701 --memory=2G \
-v /mnt/data/elasticsearch/node2/node2.yml:/data/note2/node2.yml \
-e ES_JAVA_OPTS="-Xms1024m -Xmx1024m" \
-v /mnt/data/elasticsearch/node1/:/data/node2 \
-v /mnt/logs/elasticsearch/node1/:/logs/ \
-e cluster.name="es_cluster" \
-e node.name="node2" \
-e cluster.initial_master_nodes="node1" \
-e discovery.seed_hosts="172.17.0.4:26601","172.17.0.5:26701","172.17.0.6:26801" \
-e http.port=26700 \
-e transport.tcp.port=26701 \
-e node.master=true \
-e node.data=false \
-e network.host="0.0.0.0" \
-e discovery.zen.minimum_master_nodes=2 \
elasticsearch:7.14.0
sudo docker run --name es3 --restart=always --privileged=true -d -p 26800:26800 -p 26801:26801 --memory=2G \
-v /mnt/data/elasticsearch/node3/node3.yml:/data/note3/node3.yml \
-e ES_JAVA_OPTS="-Xms1024m -Xmx1024m" \
-v /mnt/data/elasticsearch/node1/:/data/node2 \
-v /mnt/logs/elasticsearch/node1/:/logs \
-e cluster.name="es_cluster" \
-e node.name="node3" \
-e cluster.initial_master_nodes="node1" \
-e discovery.seed_hosts="172.17.0.4:26601","172.17.0.5:26701","172.17.0.6:26801" \
-e http.port=26800 \
-e transport.tcp.port=26801 \
-e node.master=true \
-e node.data=false \
-e network.host="0.0.0.0" \
-e discovery.zen.minimum_master_nodes=2 \
elasticsearch:7.14.0
也可启动后进入容器,修改配置文件后在重启容器。
4、验证
略
踩坑:
节点启动后报错at least one of [discovery.seed_hosts, discovery.seed_providers, cluster.initial_master_nodes] must be configured。看配置文件node1.yml有cluster.initial_master_nodes的配置,换了好多配置都不成功,后来在启动参数中加入这个参数就可以了。不知道原因。
节点全部启动后报master not discovered yet, this node has not previously joined a bootstrappe找不到主节点,类似脑裂的异常。配置文件和启动参数都增加了discovery.seed_hosts=""的配置且cluster.initial_master_nodes=["node1","node2","node3"],仍然报这个错误。后来将cluster.initial_master_nodes参数只指定一个节点,启动成功。原因不明,理论上可以多个。
二、docker搭建KIBANA
1、镜像拉取 docker pull kibana:x.x.x。
2、启动Kibana
sudo docker run -d --name mykibana --link myes:elasticsearch --restart=always --privileged=true -p 26100:26100 -v /mnt/data/kibana/:/data -e server.host="0" -e server.port=26100 -e elasticsearch.hosts=["http://172.17.0.2:26000"] -e kibana.index=".kibana" -e i18n.locale="zh-CN" -e xpack.monitoring.ui.container.elasticsearch.enabled=true -e elasticsearch.username="elastic" -e elasticsearch.password="elastic" kibana:7.14.0
踩坑:
启动kibana总是报错检索不到es版本信息,找不到es节点。在网上找了很多说的修改系统配置,不行,修改elasticsearch.hosts参数,也都不行。后来启动参数加入--link 容器名:elasticsearch参数才没有此报错。
后继续启动报链接elasticsearch:9200失败,后来经过验证,我的启动参数-e elasticsearch.hosts和-e server.port都没有生效。于是启动后进入容器手动修改kibana.yml配置然后重启才生效。不知为啥不生效。(有高手可以指导在下一下)
三、docker搭建logstash
1、创建规划目录,编写配置logstash.yml
http.host: "0.0.0.0"
path.data: /usr/share/logstash/data
path.logs: /usr/share/logstash/logs
path.config: /usr/share/logstash/config/conf.d/logstash.conf
config.reload.automatic: true
xpack.monitoring.enabled: true
xpack.monitoring.elasticsearch.username: elastic
xpack.monitoring.elasticsearch.password: elastic
xpack.monitoring.elasticsearch.hosts: ["172.17.0.4:26601","172.17.0.5:26701","172.17.0.6:26801"]
2、编写规划管道配置文件logstash.conf
input {

  tcp {

    port => 26000

    type => sys_log

  }

  tcp {

    port => 26100

    type => app_log

  }

}

filter {

}

output {

    elasticsearch {

              hosts => ["172.17.0.4:26601","172.17.0.5:26701","172.17.0.6:26801"]

              user => "elastic"

              password => "elastic"

    }

 }
3、启动验证
略
踩坑:
启动成功后,验证时发现日志报message=>"No Available connections"。。。。。message=>"Elasticsearch Unreachable: [http://elasticsearch:9200/。。。。明显链接到了默认es地址,配置文件里的地址没生效。读取了默认配置,进入容器查找,发现在/usr/share/logstash/config路径下也有配置(之前路径设置的不是/usr/share/),生效的是这个。修改完地址后restart报Path "/logstash/data" must be a writable directory 。上网找了下,大致情况是这个/usr/share/logstash路径是默认的自定义的容器路径没权限或是不读,所以修改下启动命令和配置在restart。
启动成功后,日志报:
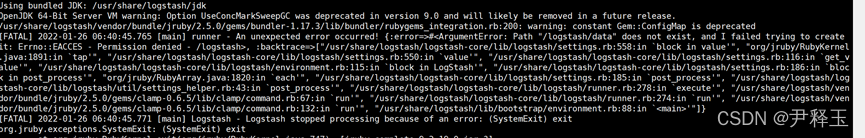
这个问题跟es的问题差不多,也是修改lvm.options将报错的GC改为G1即可。但是尝试进入容器 exec -it修改配置时总是迅速自动退出,没法改还,就很烦。。。。可以用find / -name jvm.options命令找到容器对应的jvm.options文件。然后直接vi 进行修改,再重启。
智能推荐
(Java毕业设计)招聘信息管理系统(基于java+springboot)附源码_java人力资源管理系统招聘管理-程序员宅基地
文章浏览阅读1.1k次,点赞2次,收藏17次。在Internet高速发展的今天,我们生活的各个领域都涉及到计算机的应用,其中包括招聘信息管理系统的网络应用,在外国招聘信息管理系统已经是很普遍的方式,不过国内的线上管理系统可能还处于起步阶段。招聘信息管理系统具有招聘信息管理功能的选择。_java人力资源管理系统招聘管理
冯诺依曼、哈佛、RISC、CISC_冯诺依曼曼指令和数据区分-程序员宅基地
文章浏览阅读1.3w次,点赞5次,收藏20次。几个基础材料(源:http://jwc.seu.edu.cn/zq/signal/new/importent/zhang5_6/feng.htmhttp://jwc.seu.edu.cn/zq/signal/new/importent/zhang5_6/harvard.htmhttp://dingjun.net/dingjun/html/14/84FB43402106C575.html_冯诺依曼曼指令和数据区分
Netty——深入解析心跳检测机制_netty 服务端心跳检测-程序员宅基地
文章浏览阅读428次。客户端定时每X秒(推荐小于60秒)向服务端发送特定数据(任意数据都可),服务端设定为X秒没有收到客户端心跳则认为客户端掉线,并关闭连接触发onClose回调。当需要服务端定时给客户端发送心跳数据时, $gateway->pingData设置为服务端要发送的心跳请求数据,心跳数据是任意的,只要客户端能识别即可。当设置为服务端主动发送心跳时,如果客户端最近有发来数据,那么证明客户端存活,服务端会省略一个心跳,下个心跳大约1.5*$gateway->pingInterval秒后发送。心跳检测时间间隔 单位:秒。_netty 服务端心跳检测
linux内核SPI总线驱动分析(一)_linux spi驱动总线分析-程序员宅基地
文章浏览阅读535次。下面有两个大的模块:一个是SPI总线驱动的分析 (研究了具体实现的过程)另一个是SPI总线驱动的编写(不用研究具体的实现过程)SPI总线驱动分析 1 SPI概述 SPI是英语Serial Peripheral interface的缩写,顾名思义就是串行外围设备接口,是Motorola首先在其MC68HCXX系列处理器上定义的。SPI接口主要应_linux spi驱动总线分析
Nginx,nginx-rtmp-module-master搭建直播平台-程序员宅基地
文章浏览阅读511次。Nginx,nginx-rtmp-module-master搭建直播平台_nginx-rtmp-module-master
**The sip module implements API v11.0 to v11.2 but the PyQt5.QtCore module requires API v11.3**_the pyqt5.qtcore module failed to register with th-程序员宅基地
文章浏览阅读3.6k次。*The sip module implements API v11.0 to v11.2 but the PyQt5.QtCore module requires API v11.3*情况一 SIP版本不匹配我在使用PyQt5时遇到了这个问题:“sip模块实现了API v11.0到v11.2,但PyQt5.QtWidgets模块需要API v11.3”pip列表sip 4.18,但是使..._the pyqt5.qtcore module failed to register with the sip module
随便推点
QEMU 运行 RISC-V 64 位 Linux_qemu启动riscv环境-程序员宅基地
文章浏览阅读420次。QEMU 运行 RISC-V 64 位 Linux_qemu启动riscv环境
一年对于程序员来说有多长?_程序员 一年多少秒-程序员宅基地
文章浏览阅读4.3k次。聊这个话题,我表示又蛋疼了!你想看么?还没写过这么有争议的话题,有点小小的不安!一年有多长?让我来掐指算一算:1年=365天(今年是366天)=多少小时呢?前方高能,等我去写个程序算一下!还用写程序吗?早有人写好了!有多少分有多少秒,又有多少毫秒呢?我们只需要选择一下单位就好了,结果是:1年(yr)=31536000000毫秒(ms)为什么聊这个话题?蛋当然不可能说疼就疼了!水是有源的,树是有根的_程序员 一年多少秒
idea使用码云管理项目教程_idea 使用码云维护项目-程序员宅基地
文章浏览阅读745次。第一步 : 下载git 进入git官网 https://git-scm.com/download/win 下载git软件. 我这里演示安装Git-2.16.1.4-64-bit.exe 1 . 运行 Git-2.16.1.4-64-bit.exe 点击Next 2. 选择安装目录 点击Next 3. 第二步 : 安装码云插件第三步 : 配..._idea 使用码云维护项目
js调用百度地图API创建地图,搜索位置-程序员宅基地
文章浏览阅读186次。实现代码:<!DOCTYPE html><html><head> <meta charset="UTF-8"> <meta http-equiv="Cache-Control" content="no-store" /> <meta http-equi_百度地图js api地址搜索
Excel VSTO开发1-VSTO简介_office开发版本号与vsto-程序员宅基地
文章浏览阅读986次。VSTO(Visual Studio Tools for Office)是微软开发的一种用于创建Microsoft Office应用程序的工具集,它可以让开发者在Microsoft Office应用程序中集成自己的.NET应用程序。VSTO还提供了一些特殊的工具和库,使得开发人员可以更方便地管理Microsoft Office应用程序的生命周期、访问Microsoft Office应用程序的API和对象模型、处理Microsoft Office应用程序的事件和异常等。Office版本:2016 32位。_office开发版本号与vsto
3 cmake-生成dll和lib_cmake生成dll和lib文件-程序员宅基地
文章浏览阅读8.9k次。1 工程目录最顶层的CMakeList.txt添加add_subdirectory (CMakeLibDemo)add_subdirectory (CMakeLibDemoUse)2 文件ALU.h#pragma once#define DllExport __declspec( dllexport )//宏定义#ifndef ALU_H #define ALU_H #include <iostream> using namespace std;class Dll_cmake生成dll和lib文件